
Experimental methods
This page provides brief descriptions of commonly used experimental methods in neuroscience and cognition, for those unfamiliar with them.
Peristimulus time histogram (PSTH)
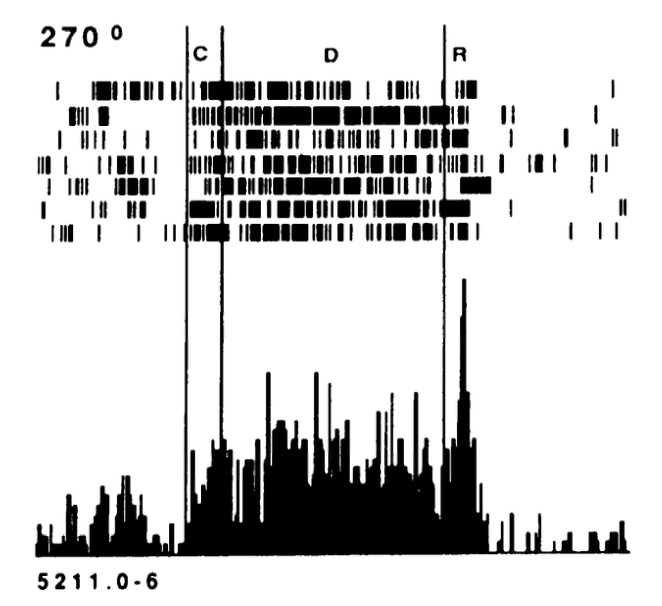
Figure 1: The peristimulus time histogram (PSTH) plot like this one from Funahashi et al, 1988 is a widely used way of plotting neural firing data, with the top portion showing individual neural spikes as a “raster” plot, with each row being a separate trial, with important experimental time points indicated with vertical lines. The bottom portion shows a histogram, often of a larger pool of data than is shown in the raster plot, with the bar height showing the relative frequency of firing within the corresponding time bin. This plot shows a PFC neuron repsonding to a cue at time C, which is maintained over the delay period D, and firing abrubly terminates right after the onset of the response R.
Figure 1 shows an example peristimulus time histogram (PSTH) plot, which is widely used to show individual neural responding across repeated trials of a given type. This gives a good sense of the baseline firing levels before and after the condition of interest, and you can see how reliable and strongly or weakly modulated the activity as a function of the task inputs as labeled.
Representational similarity analysis (RSA)
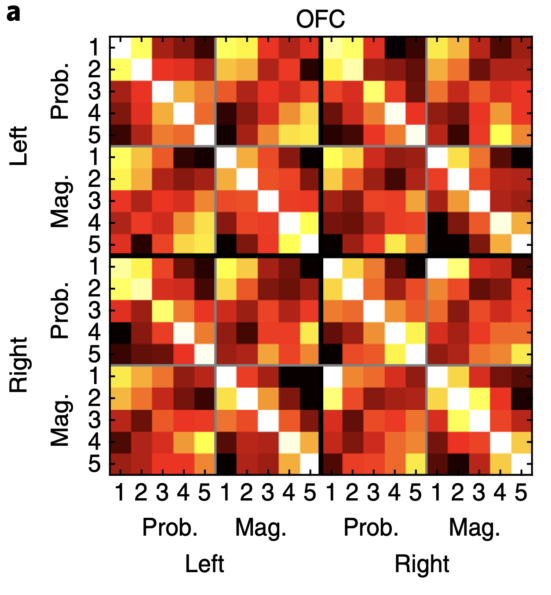
Figure 2: The representational similarity analysis (RSA) similarity matrix plots the similarity metric for activity patterns across different experimental conditions. Each cell is the similarity or distance value for the activity pattern in the condition labeled on the horizontal axis vs. the one on the vertical axis. Often a correlation is used, where 1 is the identity value, and 0 is uncorrelated. A distance metric with increasing distances can also be used. This data is from Hunt et al., 2018.
Figure 2 explains the similarity matrix (which can alternatively be a distance matrix) used to show the overall patterns of responding across a number of different conditions, labeled on the horizontal and vertical axes, such that each cell has the value for a given combination of conditions.
This type of plot is typically better than looking at individual neural firing, because it conveys more of a population-level responding, as explained in distributed representations.